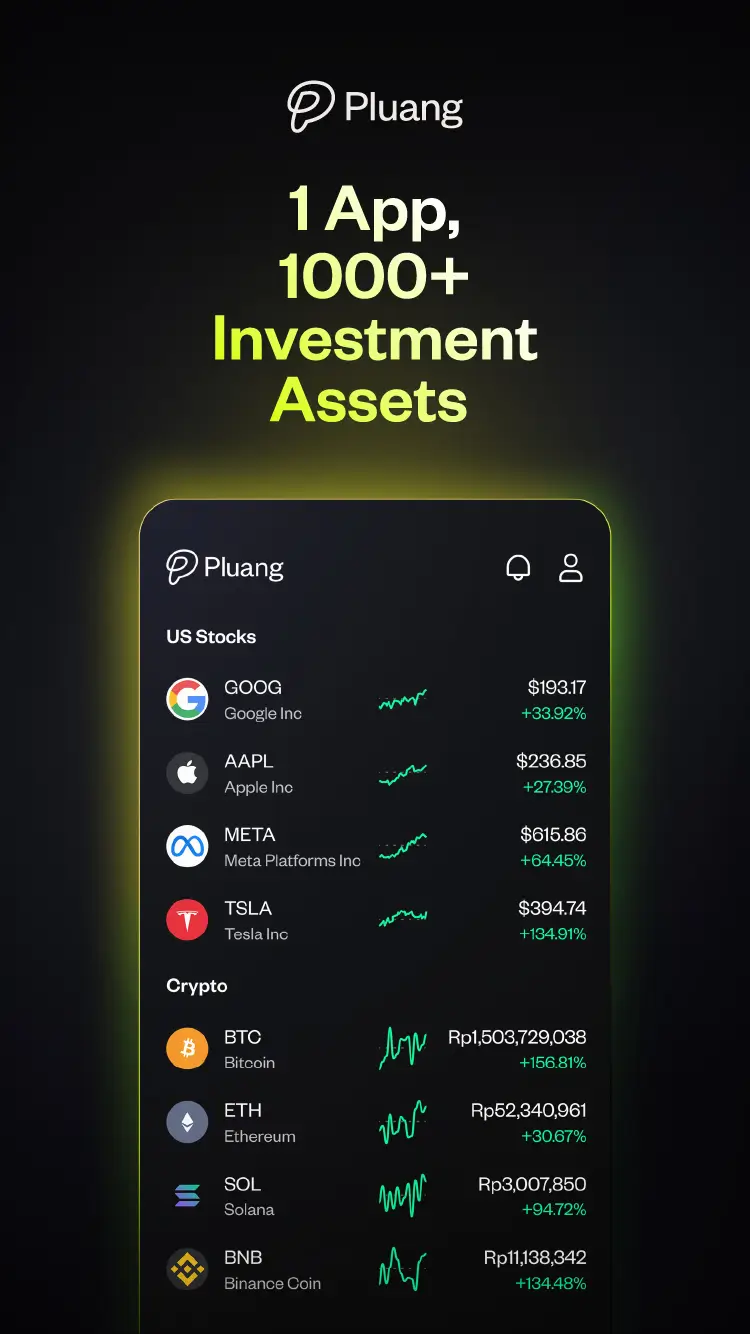
Trade on Pluang
One platform for all markets
Download

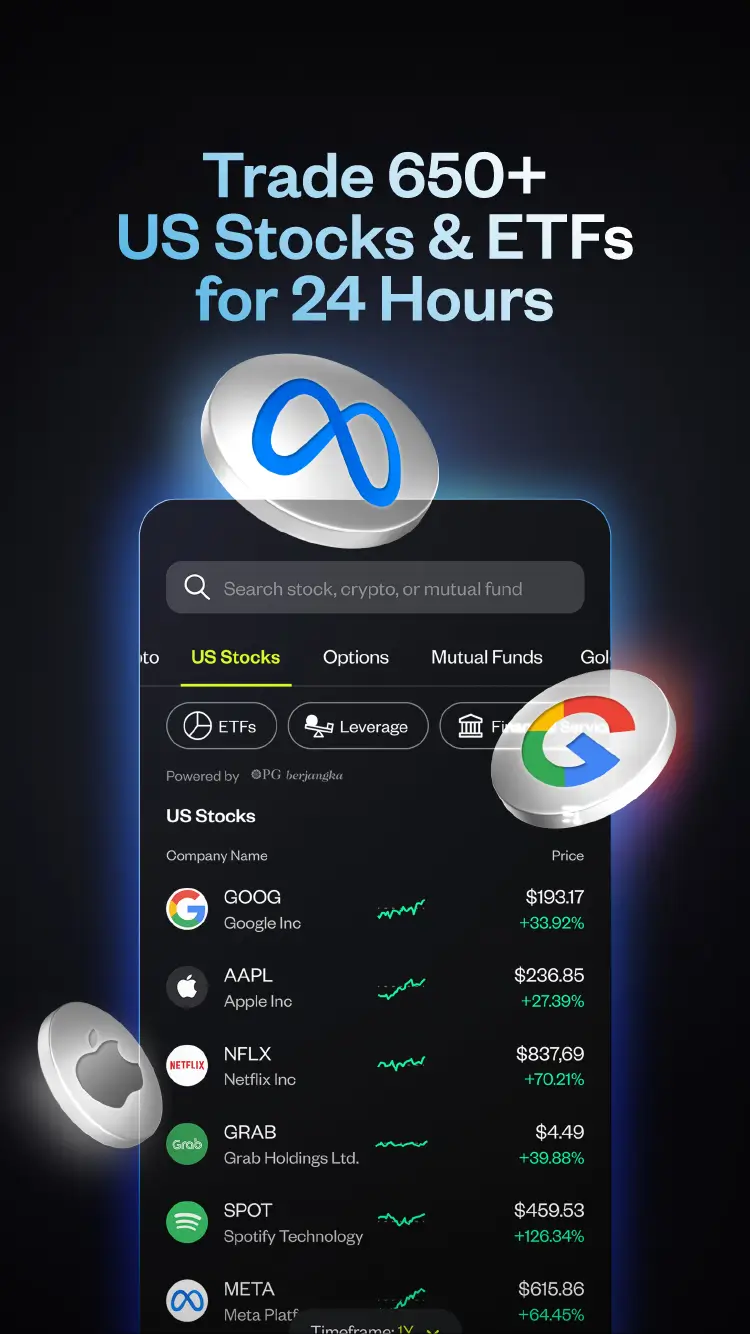


US 52-Week Low Stock List with Prices, Market Trends and Insights Today [28/86]
View real-time US stock prices, top movers, and performance data. Track major companies, compare trends, and analyze metrics to support smarter investing.
Sort:
Market Cap (high to low)
Time:
1D
Filter
| Name | Price | Price | Change (Last 24h) | Market Cap | Charts | ||
|---|---|---|---|---|---|---|---|
AIGAmerican International Group Inc | $78.68 | $78.68 +2.06% | $42.1B | ||||
KGCKinross Gold Corporation | $34.95 | $34.95 +4.63% | $41.8B | ||||
KRKroger Co | $68.19 | $68.19 +2.34% | $41.8B | ||||
MSCIMsci Inc | $568.55 | $568.55 +1.51% | $41.6B | ||||
ALNYAlnylam Pharmaceuticals, Inc. | $309.66 | $309.66 -7.12% | $41.3B | ||||
TRIThomson Reuters Corp | $93.01 | $93.01 +0.63% | $41.2B | ||||
EDConsolidated Edison, Inc. | $110.15 | $110.15 -0.12% | $40.6B | ||||
CCLCarnival Corp | $29.22 | $29.22 +1.39% | $40.5B | ||||
ALCAlcon AG | $81.32 | $81.32 +0.73% | $39.8B | ||||
NBISNebius Group NV | $157.14 | $157.14 -5.77% | $39.8B | ||||
ID Market
IHSG
7,634.00
+0.17%
IDX 30
403.47
+0.07%
Commodities
Gold*
$4,766.00
-2.33%
Silver*
$78.88
-3.63%
Copper
$6.03
-1.42%
Crude Oil
$88.49
+7.14%
*Gold and Silver prices are based on future markets.
Global Market
ASX 200
8,946.90
-0.09%
SSE
4,051.43
-0.10%
HSI
26,160.33
-0.89%
STI
4,997.93
-0.20%
Nikkei 225
58,475.90
-1.75%
DAX 30
24,702.24
+2.27%
FTSE 100
10,667.63
+0.73%
CAC 40
8,333.60
-1.00%
Currencies
USD/IDR
Rp17,193
0.00%
EUR/IDR
Rp20,095
-0.56%
GBP/IDR
Rp23,069.76
-0.61%
JPY/IDR
Rp107.56
-0.70%
CNY/IDR
Rp2,512
-0.35%
Bonds
US 2 Yr
+3.71%
-1.85%
US 10 Yr
+4.26%
-1.39%