How do gold assets look in the Pluang application?
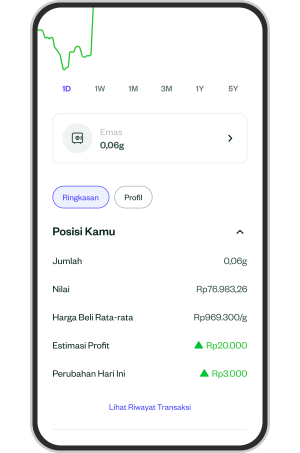
Here is a view of the asset page and the information listed in the "Your Position" section on the gold asset:

The price listed on the gold asset page is the middle price.
The following is the information listed in the "Your Position" section on gold assets:
|
Information |
Explanation |
|
Amount |
The number of gold asset units you own. |
|
Mark |
The rupiah value of the gold assets you own is in accordance with the market price. |
|
Average Purchase Price |
The total amount invested divided by the total units purchased. |
|
Profit Estimate |
The estimated profit or loss you will get if you sell your current asset. This estimate is calculated from the difference between the middle price and the average purchase price. For example, you have gold with the following details:
The calculation is as follows: = Middle price – Average purchase price = Rp980.000 – Rp950.000 = Rp30.000 per gram x 10 gram = Rp300.000 So, if you sell your gold today, you have a potential profit of Rp300,000. |
|
Today's Changes |
Estimated profit/loss you will get today. For example, you have a gold asset with the following details:
Calculation: = Today's price – Yesterday's price = Rp980,000 – Rp970,000 = Rp10.000 per gram x 5 = Rp50.000 The price of gold rose by Rp10,000 per gram today, so if you sell today, you have the potential to make a profit of Rp50,000 compared to yesterday's value. |
Here is some other information you can get on the assets page:
|
Information |
Explanation |
|
3M Drawdown |
The rate of decline in gold prices from its peak to its lowest point. This decline is influenced by the timeframe. |
|
Trading Activity |
The percentage of Pluang users who increase or decrease their investment position in the relevant asset through trading during the last 24 hours. Increased buying activity indicates that this asset is in demand. |
|
Typical Hold Time |
The median time indicates how long Pluang users held this asset before selling it. A long holding time indicates an accumulation trend. A short holding time indicates increasing movement to other assets. |