





pluang insight
Berita & Analisis
DSSA: The Only Complete AI Infrastructure Chain in Indonesia

In FY25, GEMS contributed ~86.4% of DSSA revenue and redeployed cash flows from its coal business into a multi-year transition toward green energy. This strategy includes building ~480 MW of geothermal capacity by 2029, located in Cipanas, Cisolok–Cisukarame, Jambi, West Sumatra, Central Sulawesi, and Nage and 1–2 GW of integrated solar cell/module manufacturing at Kendal (JV Trina Solar + PLN). We forecast geothermal revenue will rise from USD 316.9k in FY25 to USD 83.7mn in FY30F. Overall, we see this as a strategic reinvestment of coal-derived windfalls into long-term, ESG-aligned earnings diversification.
Cable TV, internet and technology revenue is expected to rise from USD 211.8mn in FY25 to USD 1.4bn in FY30F. DSSA operates Indonesia's only vertically integrated green digital platform: renewable power + hyperscale-grade Tier IV DC (SM+) + fiber (MoraRepublic) + satellite (PSN) + potential stake in XLSmart. The green power + low-latency combination is the only combination that satisfies hyperscalers' 2030 carbon-free energy (CFE) commitments in Indonesia. With Axiata exerting day-to-day operating influence over XLSmart, transfer pricing risk between DSSA-affiliated entities and the listed telco is mitigated. DANA's 200mn-user dataset is the only complete Indonesian AI training corpus — covering payments, location, credit, spending.
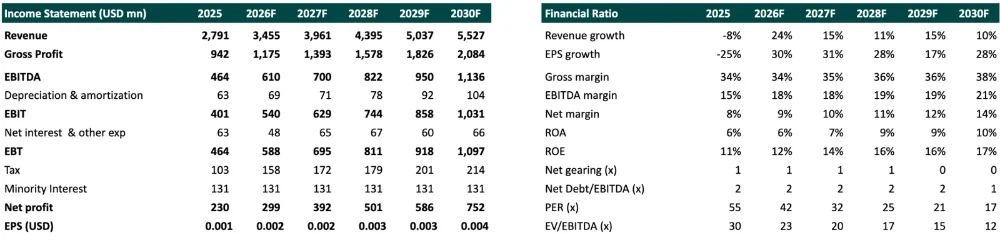
The new rising businesses earn structurally higher margins and more stable than coal, we expect DSSA's net margin to expand from 8.3% in FY25 to 13.6% in FY30F, driven by (1) Its legacy coal business expected to generate USD1.3 bn in net profit over from FY26F onwards; (2) XLSmart's equity contribution flips, as we forecast EXCL will concert from a profit drag of IDR4.4 tn (FY25, merger integration) to +IDR 1.1tn (USD 61.7mn) by FY27F, as IDR 820bn Opex synergies materialize (3) MyRepublic reaches operating leverage inflection by FY30F as the network scales to ~32mn home passes, with incremental subscribers adding at near-zero infrastructure cost; (4) Commissioning ~480 MW of geothermal across Cipanas, Cisolok–Cisukarame, Jambi, West Sumatra, Central Sulawesi and Nage WKPs at an estimated PPA tariff of ~IDR 1,700/kWh under long-dated PLN offtake; and (5) Building 1–2 GW of vertically integrated solar cell and module capacity at Kendal Industrial Park.
Our TP is SOTP-based, blending GEMS, geothermal, SM+ DC, DANA, XLSmart and Rolimex valuation. Three re-rating events: first geothermal COD, and SM+ anchor tenancy. Key risks remain: coal price deterioration remains the primary near-term earnings vulnerability, Danantara single gate export system payment, control and implementation, regulatory approvals for SMX01 data center operations, geothermal WKP development timelines, EBT implementation in China and China JV regulatory environment. DSSA's AI application layer relies on partnerships with iFLYTEK and China Mobile (ASIX JV).
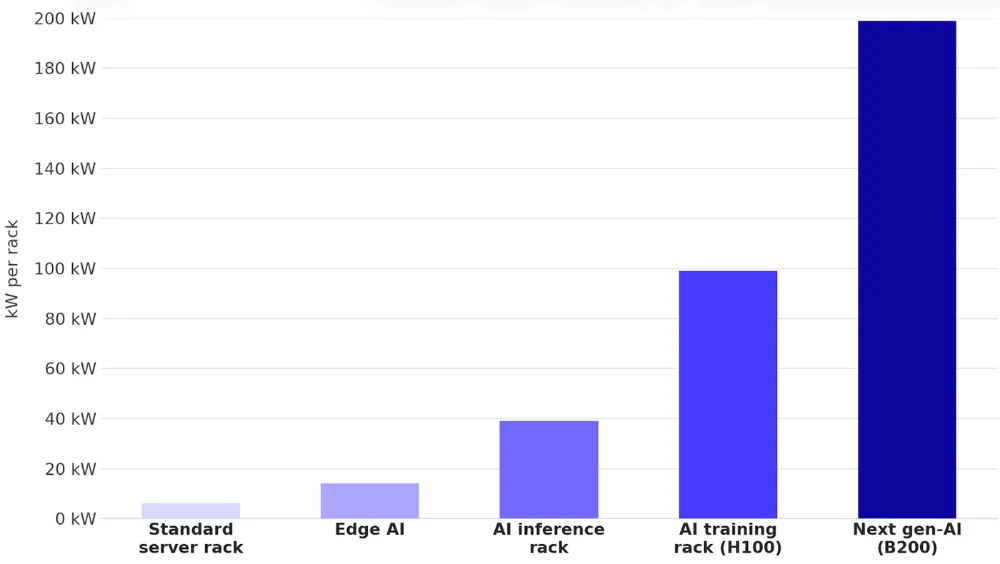
Power as a Data Center Moat. Data centers are among the most energy-intensive infrastructure assets on earth, with power typically representing 40–60% of total operating costs. AI racks amplify this dynamic: a next-generation B200 GPU rack draws 200 kW — 20x the power of a standard server rack. At SMX01's full build of 2,400 racks, peak power draw approaches 240 MW. To support at the energy level, DSSSA developing up to 480 MW of geothermal capacity across six WKPs (Cipanas, Cisolok–Cisukarame, Nage, Jambi, West Sumatra, Central Sulawesi) targeting 2029F COD, and 1–2 GW of integrated solar cell and module manufacturing at Kendal Industrial Park (JV Trina Solar + PLN).
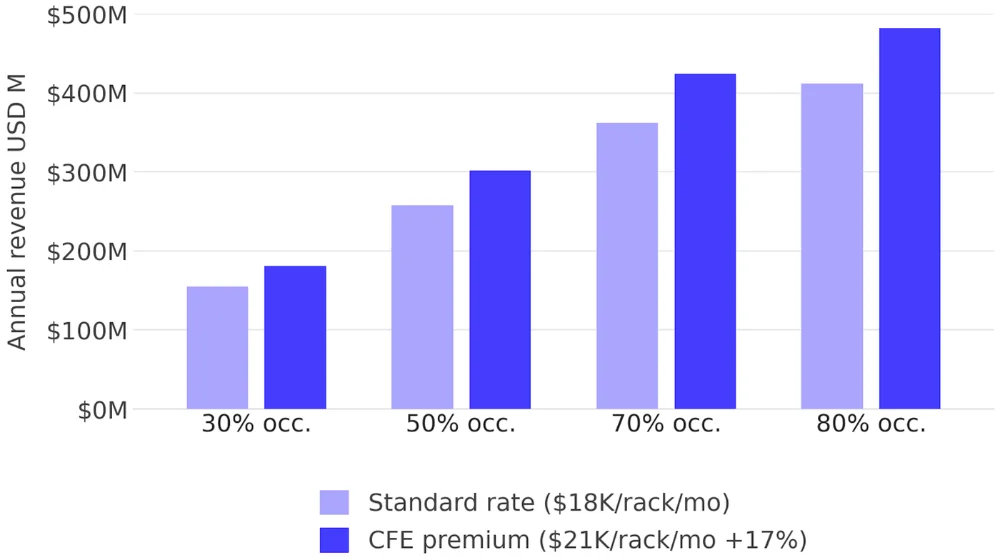
ESG Differentiation — A Category-of-One Offering. A Tier IV data center backed by Indonesian geothermal power — the world's most stable and carbon-zero baseload renewable source — is a category-of-one offering in Southeast Asia. This differentiation creates three compounding advantages:
Source: AWS/Google/Microsoft sustainability reports 2024, Pluang Research Team
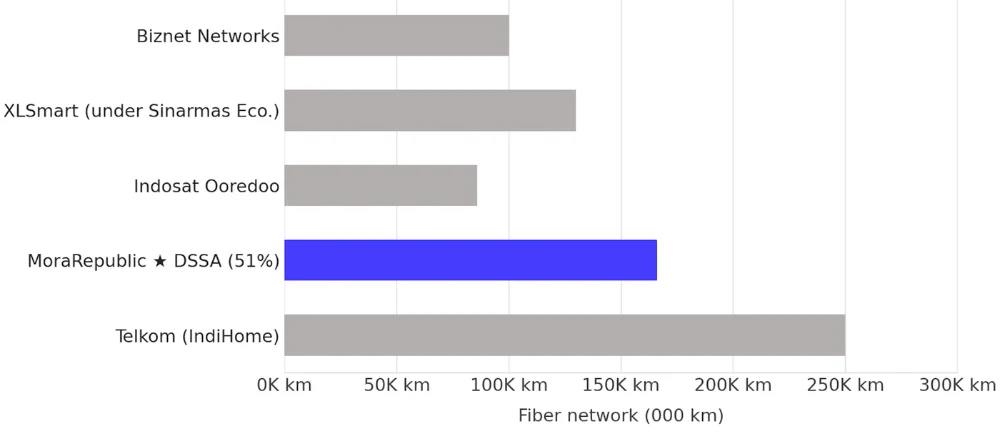
Fixed broadband household penetration in Indonesia sits at 22% — versus 83–95% across developed Asia. With 75mn total addressable households, reaching 50% penetration requires 21mn more home passes. MoraRepublic, formed through the April 2026 merger of Moratelindo and MyRepublic, now holds 12.7mn home passes and 2.6M retail subscribers, ranking #2 nationally. The operating leverage inflection arrives at FY28F: once backbone is sunk, every incremental subscriber adds revenue at near-zero infrastructure cost.
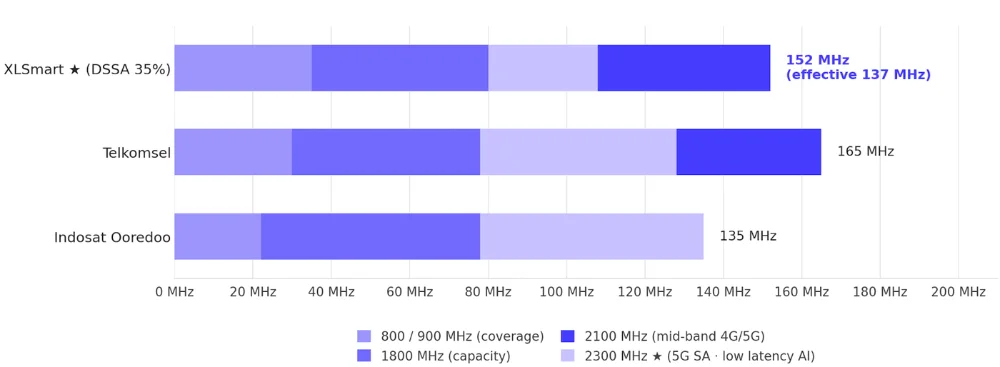
The Latency Moat. AI inference workloads require sub-10ms round-trip latency for real-time response. MoraRepublic's owned fiber delivers approximately 3ms to SMX01. XLSmart's 5G SA on the 2300 MHz band — the only mobile network in Indonesia meeting the AI inference latency requirement — delivers approximately 8ms. Third-party WAN averages 15–40ms. Satellite sits at 600–1,000ms. The gap is not incremental — it is a hard technical qualification threshold. Any enterprise AI workload requiring real-time inference can only be reliably served from a facility with owned fiber or 5G SA access.
The Cost Moat. At 60 MW full build, DSSA's combined power and transport cost runs approximately USD 34M per year. A grid-plus-leased-WAN competitor faces approximately USD 79M per year — a USD 45M annual structural disadvantage that compounds with every exabyte of AI inference traffic growth and every PLN tariff revision. Indonesia's total internet traffic is projected to double by 2030; AI inference traffic grows 10× over the same period. Every company leasing bandwidth faces cost escalation with every additional exabyte. DSSA carries this growth at near-zero incremental transport cost because the fiber is already owned.
The Full-Stack Connectivity Architecture. The XLSmart is the missing piece that completes DSSA's four-layer converged connectivity architecture: (a) FTTH broadband across 80+ cities via MoraRepublic for residential and SME, (b) 4G/5G mobile connectivity reaching ~73M XLSmart subscribers nationally, (c) satellite backhaul via PSN (310 Gbps) for rural and maritime coverage, and (d) edge and hyperscale DC capacity via SM+ serving both fixed and mobile network traffic. This mirrors the playbook of SoftBank, Deutsche Telekom, and Singtel — each of which commands a material valuation premium over pure-play telcos because convergence unlocks cross-sell, traffic monetisation, and enterprise solutions optionality that single-layer operators cannot replicate. For DSSA, the concrete synergy levers are: (i) reduced churn through fixed-mobile bundled plans, (ii) shared network infrastructure eliminating duplicate civil works and backhaul capex, and (iii) cross-selling DANA payments, Vidio content, and SM+ cloud services into the combined 73M+ XLSmart subscriber base. Cable TV, internet, and technology revenue is forecast to grow from USD 211.8mn in FY25 to USD 1.1bn in FY30F.
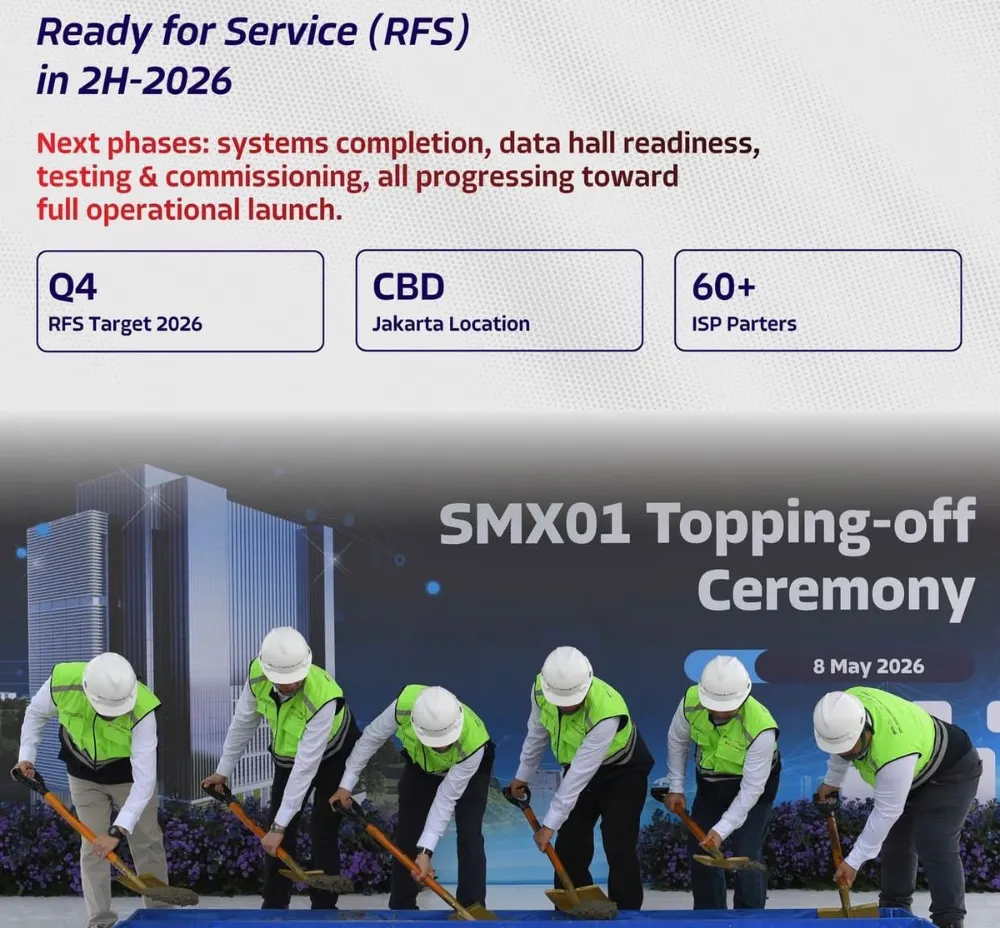
The Facility. SMX01 is a 60 MW full-build Tier IV data center on Jakarta CBD — Developed through a 50:50 joint venture with LG CNS (LG Sinar Mas), the facility supports up to 2,400 high-density GPU racks at 130 kW per rack, with liquid cooling systems purpose-built for AI and HPC workloads. Initial IT load is 18 MW at Q4 2026 COD, scaling to 60 MW at full build. The USD 300M+ investment is underpinned by LG CNS's direct hyperscaler RFP access, materially shortening the time to first anchor tenant. The SM+ edge DC portfolio — 25 facilities across 24 cities at 24 MW total — provides the distributed footprint that hyperscalers require for latency-sensitive inference at the network edge, and positions DSSA as the only operator offering both hyperscale and edge in a single contract.
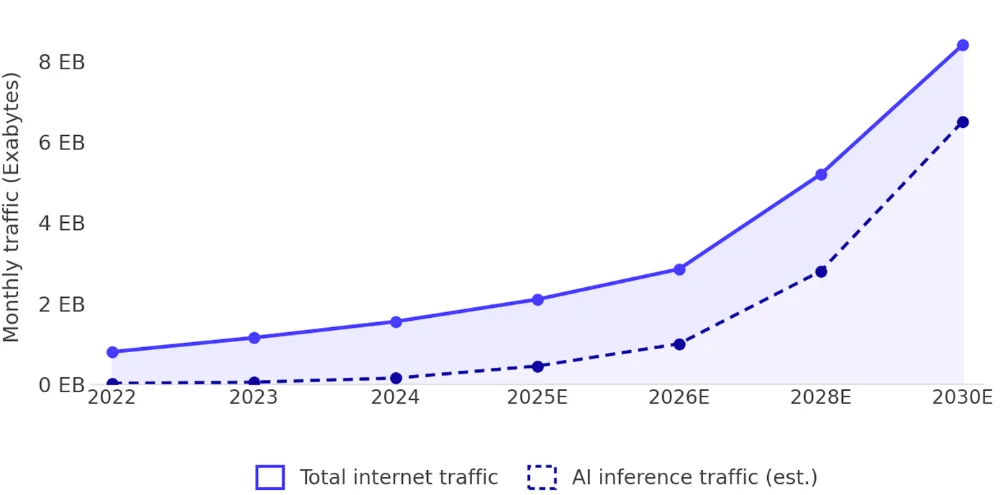
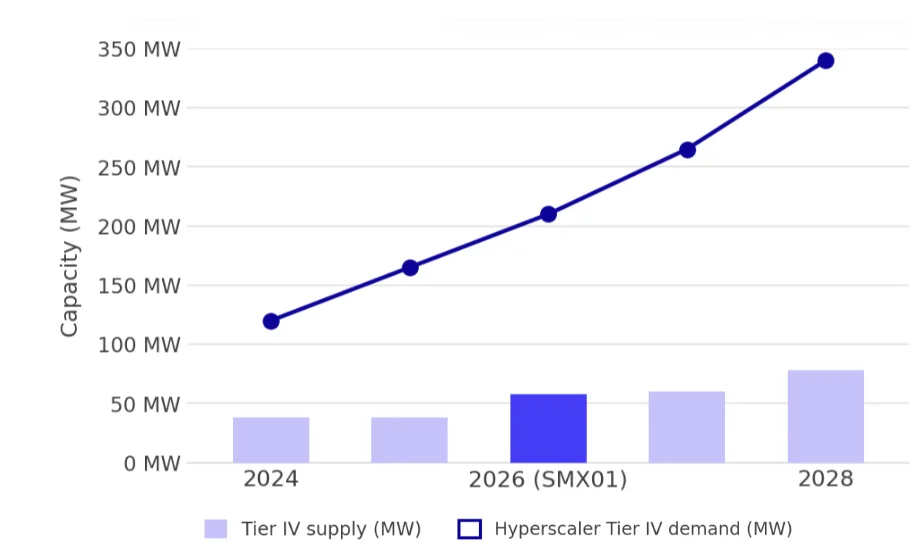
The Occupancy Economics. The EBITDA profile is highly convex to occupancy: at 50%+ fill, incremental racks are approximately 85% EBITDA margin. At 60 MW and 70% occupancy, SMX01 alone generates approximately USD 130M EBITDA per year — against a current SOTP value of USD 180mn. A single hyperscaler anchor tenant signing re-rates the SM+ asset from USD 180mn to an estimated USD 820mn–1.0bn on an EV/EBITDA basis consistent with regional DC peers, adding up to USD 820M to group SOTP from one announcement. That re-rating event is the single most powerful near-term catalyst in the DSSA story, and the LG CNS JV structure means access to the RFP processes where it happens.
DSSA's application layer does something that pure-play data center operators cannot: it creates AI workload demand that fills SMX01 before a single external customer signs, and generates the AI training dataset that makes Indonesian-language AI models actually work. Hyperscalers who want to build AI for Indonesia's 270mn population — the fourth largest in the world — need DSSA's data layer.
DANA: Indonesia's AI Training Dataset. DANA, Indonesia's #1 digital wallet with 200mn+ registered users. It functions as a premier engine for regional AI insights, quietly mapping diverse transaction patterns, location signals, consumer behavior, and credit indicators. By capturing 78% of the adult population — DANA holds an unmatched, high-fidelity data footprint in the market. This dataset took six years to build organically. It cannot be acquired, replicated, or fast-tracked. Any hyperscaler, AI lab, or financial institution seeking to train Indonesian-language financial AI models needs access to this data layer. DSSA's 20% stake is currently valued at USD 400mn on a cost basis. At a conservative USD 15–25 per user valuation (consistent with GoPay and regional fintech comps), DSSA's stake alone is worth USD 600mn–1bn — representing USD 200–600mn.
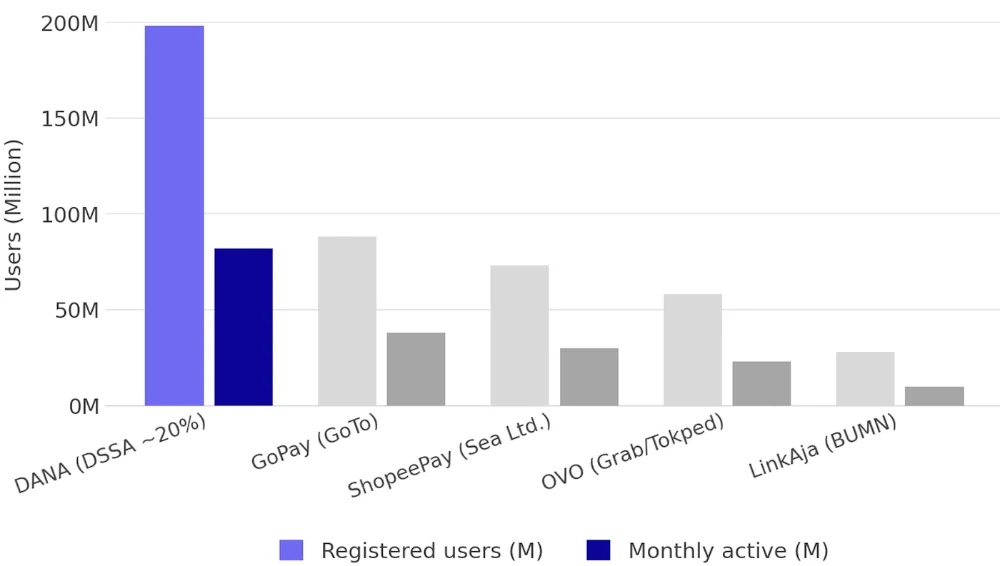
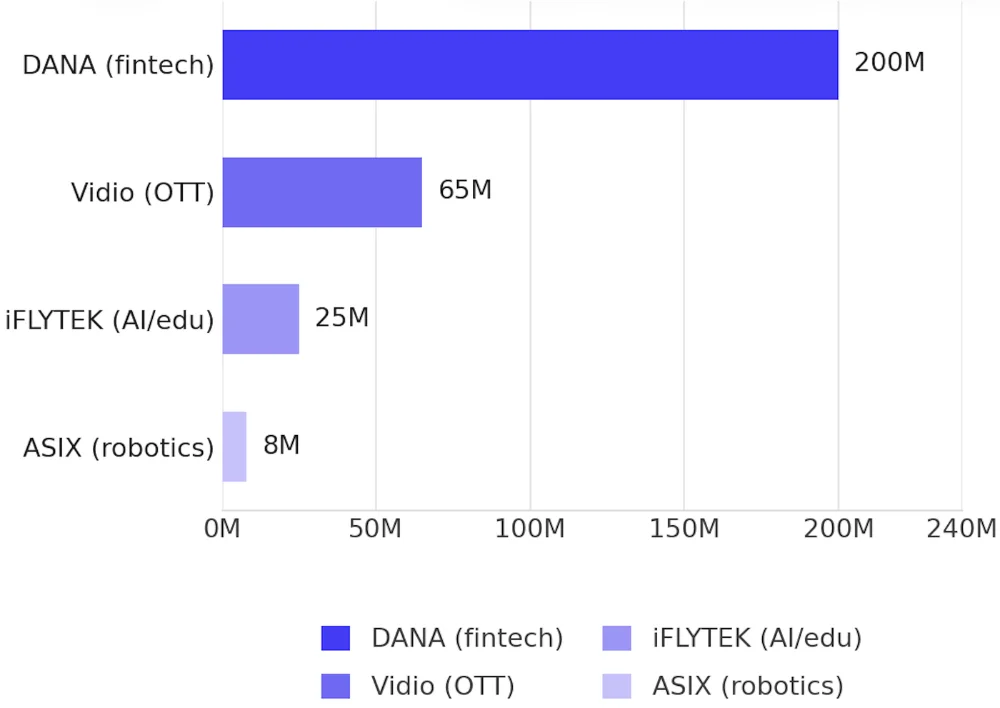
The AI Demand Stack. Beyond DANA, DSSA's application layer generates an estimated 131M GPU-hours per year of AI compute demand across its ecosystem: DANA (~55M GPU-hrs/yr): Real-time fraud detection, credit scoring, transaction personalisation — perpetual inference demand at scale, iFLYTEK (~36M GPU-hrs/yr): LLM inference for SPARK education platform and health AI — batch and real-time mixed workloads, Vidio (~24M GPU-hrs/yr): Content recommendation, metadata tagging, DOOH ad targeting via TMN Digital and ASIX + China Mobile JV (~16M GPU-hrs/yr): AI robotics training and inference workloads.
This demand provides SMX01 with a base utilisation floor that external-facing DC operators must spend years of sales cycles to replicate. The Sinarmas group itself — with businesses spanning financial services, property, agribusiness, and infrastructure — represents additional migration of connectivity, power, and digital spend onto DSSA's platform that further fills the stack from day one.
Non-coal revenue is forecast to grow from USD 303.1mn in FY25 to USD 1.7bn by FY30F, as each application layer generates compounding demand on the layers below it: more users generate more AI workloads, more AI workloads fill more compute capacity, more compute capacity justifies more connectivity investment, and more connectivity makes the owned energy even more valuable.
Valuing DSSA requires a Sum-of-the-Parts (SOTP) framework that disaggregates the conglomerate into its constituent businesses, each with distinct growth profiles, risk characteristics, and comparable market multiples.
First, the legacy coal business DCF at USD7.6 bn (51% stake), while the largest component, uses a terminal growth rate of 3%, which is appropriate for a business with a defined reserve depletion horizon. The WACC of 9.2% reflects DSSA's Sinar Mas parentage (lower sovereign risk premium), USD-denominated revenues, and investment-grade balance sheet.
Second, the geothermal renewable energy component at USD2.6 bn is striking, yet it represents capacity that will not be operational until FY29F at the earliest. The EV/MW methodology benchmarked against BREN, ARKO and PGEO effectively implies the market will re-rate DSSA toward the premium multiples commanded by dedicated renewable energy holding companies. DSSA is systematically redeploying this cash into two asset classes that earn structurally higher multiples: 480 MW of geothermal capacity (EV/MW ~5.4x) and SM+ data centers (USD 10mn/MW cost basis). On top of that, we expect, every USD 1 of coal OCF reinvested into geothermal or hyperscale data centers is worth approximately 2.0–2.5x more in enterprise value.
DSSA trades at 42× PER 2026F and 1.4× PEG — the lowest growth-adjusted multiple in the global data center and AI infrastructure peer set. Equinix trades at 9.0× PEG, NEXTDC at 4.5×, GDS Holdings at 1.9×. The market is paying premium multiples for single-digit EPS growth at pure-play names and underpricing DSSA's 25–29%/yr EPS compounding through 2028F.
The discount is structural, not fundamental: DSSA is still classified and modelled as a coal conglomerate. As DC revenue mix rises from near zero today to an estimated USD 200mn+ by FY28F, and as geothermal COD shifts EBITDA contribution from energy toward renewables, the coal narrative compresses and the infrastructure narrative expands. Three catalysts — SMX01 anchor tenant, XLSmart + DANA ecosystem crystallisation, and geothermal first COD — converge within 36 months, each independently re-rating the stock.
| Business Component | Total shares / Matrix | Total EV Contribution (USD mn) | Approach |
|---|---|---|---|
| GEMS | 51% | 7,642 | DCF Valuation ; WACC 9.2% ; TG 5% |
| MORA + My republic | 51% | 356 | DCF Valuation ; WACC 10% ; TG 5%; implied future corporate action |
| EXCL | 35% | 2,354.2 | DCF Valuation ; WACC 8.1% ; TG 3% |
| Data center | 18 MW Only calculate hyperscaler | 180 | Using cost basis approach assumption @10mn USD / MW. Hyperscaler: Capacity will start 18 MW and can be upscaled to 60 MW Enterprise: Current 24 MW |
| Geothermal + Renewable Energy | 480 Mw (EV/MW) | 2,592 | Peers selected : PGEO, ARKO, BREN. EV/MW: 5.4x |
| Vidio | Cost basis | 27 | Cost basis approach, total investment in the company |
| Fertilizer | EV/ Sales | 211 | Sales assumption FY26F = Fertilizer: 164k ton, pepsticide: 8,335k liter, chemical: 163k ton |
| Dana | Cost basis (20% stake) | 400 | Cost basis approach and assumption: 2022 : Valuation = 1.2bn USD ; 120 mn user (value per user = 10 USD) 2026 : Estimated user = ~200 mn user (value per user = 10 USD) 2bn * 20% = 400 mn (EV) |
| Other | Cost basis | 225 | Cost basis approach for satellite backhaul infrastructure |
| Total EV (USD mn) | 13,988 |
PT Dian Swastatika Sentosa Tbk (DSSA) operations are organized into five core pillars: (1) coal mining and trading via PT Golden Energy Mines Tbk (GEMS), Indonesia's second-largest thermal coal producer; (2) technology and digital infrastructure through PT Ekamas Mora Republik Tbk, and Data Centers; (3) power and steam division to industrial hubs in Serang, Tangerang, and Karawang. (4) DSSA maintains a strong presence in specialized chemical and fertilizer trading for the industrial and plantation sectors, while rapidly scaling its renewable energy portfolio through solar and geothermal initiatives.
| Entity | Segment | DSSA Stake | Description |
|---|---|---|---|
| PT Golden Energy Mines Tbk (GEMS) | Coal Mining | 51% | Indonesia's 4th-largest coal producer (based on reserves); main cash cow for DSSA |
| PT Ekamas Mora Republik Tbk (MORA) | Telecom/Tech | 51% | 166k km fiber network serving over 2.6mn retail customers, 17k enterprise customers, and 12.7 mn homepasses |
| SM+ Data Centers | Digital Infra | Majority | 25 edge facilities; 18MW (can upscaled to 60 MW) Tier IV JV; Enterprise (wholly owned): running 24MW |
| Pasifik Satelit Nusantara (PSN) | Satellite | Minority | 310 Gbps satellite capacity; rural backhaul |
| DANA E-wallet | Fintech | ~20% | 200mn+ users |
| Vidio | Media/OTT | Minority | Indonesia's largest local OTT streaming platform |
| TMN Digital OOH | Media | Minority | Indonesia's largest digital out-of-home ad network |
| PT XLSmart (EXCL) | Telco | JV | Indonesia's third-largest mobile operator |
| Dian Solar / Kendal JV | Solar Energy | JV | 1 GW solar cell & module plant; expandable to 2 GW |
| Geothermal WKPs | Geothermal | JV | Cipanas, Cisolok, Nage; 480 MW combined potential |
| PT Rolimex Kimia Nusamas | Chemicals | Subsidiary | Nationwide fertilizer & pesticide distribution |
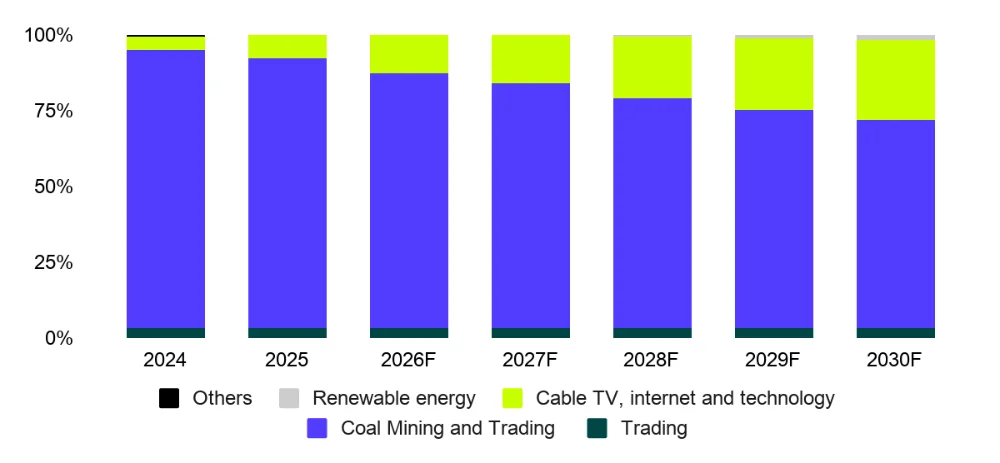
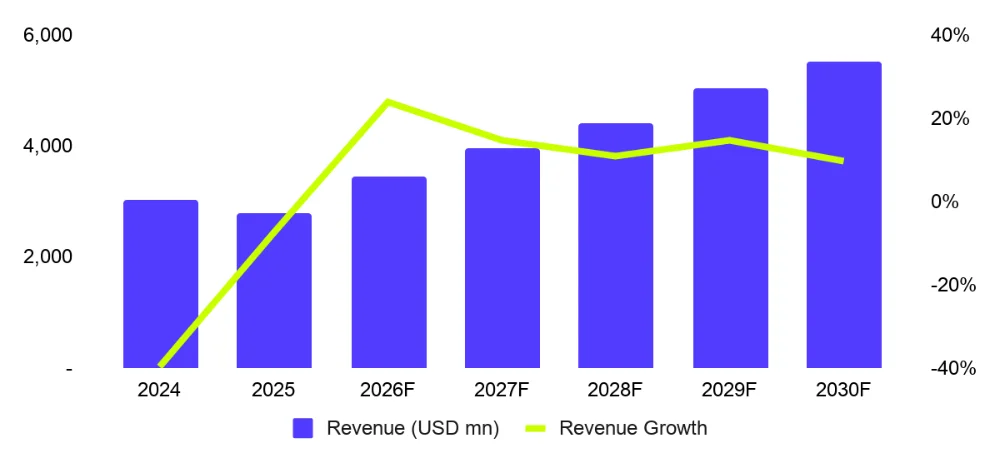
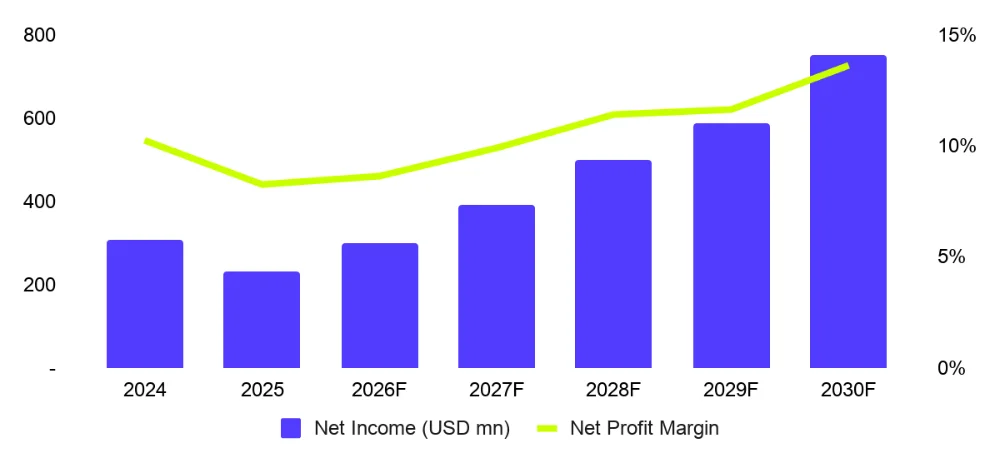
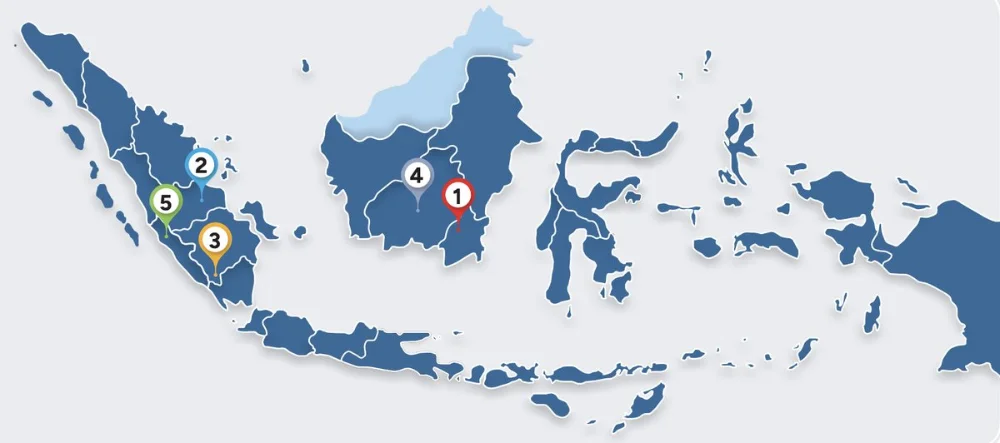
GEMS focuses on producing high-calorific thermal coal, ranging from 3,000 to 6,600 kcal/kg, primarily used for power generation. The company operates through five subsidiaries (Figure 7): 1. BIB (24,100 ha), 2. KIM (2,610 ha), 3. BSL (23,300 ha), 4. TKS (11,455 ha), and 5. EMS (4,739 ha) with mining assets spread across Kalimantan and Sumatra. According to its 2025 operational data, GEMS ranked as the fourth-largest coal company by reserves, with 0.84 bn tons of coal reserves. It produced 54.9mn tons and a sales volume of 54.2 mn tons of coal, of which ~93.6% came from BIB.
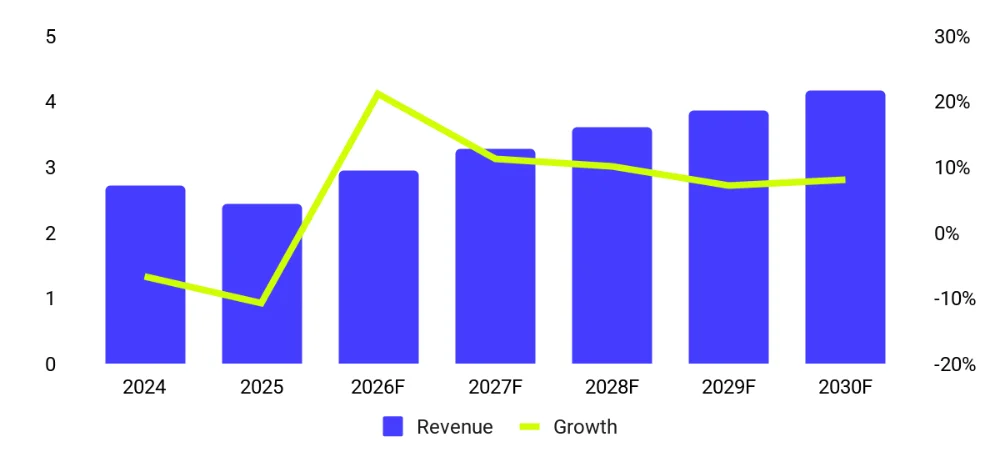
Through two business segments, coal trading and mining, which grew at a CAGR (FY22/FY25) of -6.15%, with a 99.7% proportion dominated by the coal trading segment for FY25. We estimate GEMS will record revenue growth of 11.4% CAGR (FY25/FY30F), with the majority of GEMS' revenue originating from export activities at a proportion of ~66.8% in FY30F. Of these exports, ~50.2% were destined for China, followed by ~6.3% for India and several other destination countries such as the Philippines, South Korea, Thailand, Vietnam, and others.
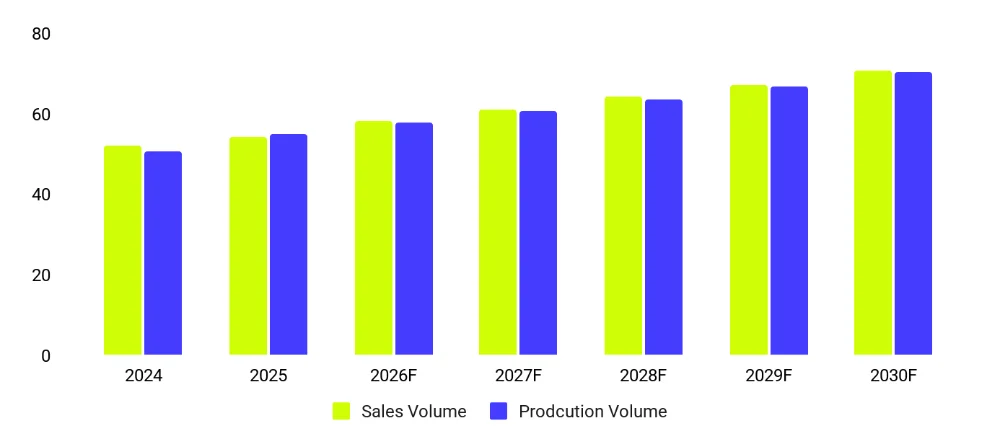
We estimate that production volume will grow 5.0% CAGR (FY25–FY30F) to 70.1mn tons in FY30F and sales volumes will experience a 5.4% CAGR (FY25–FY30F) to 70.6mn tons (Figure 8). This forecast primarily considers the accelerating energy demand for AI in China, where coal can be the affordable energy resource, we expect the demand to still grow as it forecast, China's electricity consumption is projected to reach approximately 13,757 TWh by 2030 (GlobalData & the International Energy Agency (IEA)). Coal demand in Indonesia is also still high as its massive industrial "downstreaming" push, particularly in nickel and aluminum smelting for the EV supply chain, and domestic electricity demand, still relies heavily on coal-fired power plants.
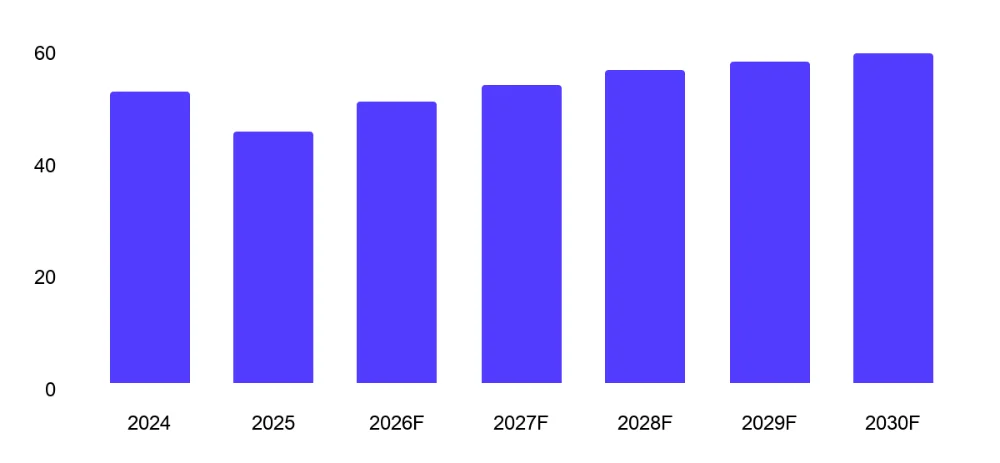
In terms of the ASP (average selling price), heightened geopolitical uncertainty around the Iran-US conflict and the Strait of Hormuz has provided a significant uplift for coal pricing. Diplomatic frameworks aimed at de-escalation have been announced, only for implementation to stall and the Strait to be intermittently reopened and re-closed amid disputed claims between the parties — a pattern that has kept shipping, insurance, and LNG markets pricing in persistent disruption risk rather than a clean resolution. Consistent with that, Newcastle coal has remained well above pre-conflict levels even as headlines periodically suggest progress toward a deal. We do not assume the conflict resolves cleanly or quickly; rather, we use the base case — partial resolution, with intermittent disruption and elevated LNG exposure persisting for around six months — as our working price assumption for the model: Newcastle at USD 130–155/t, implying a GEMS ASP of approximately USD 44–53/t for FY26F.
| Thermal Coal ASP Scenario | Newcastle USD/t | Driver | GEMS ASP Implication |
|---|---|---|---|
| Current spot (June 2026) | ~USD 143–148/t | Iran War LNG disruption; gas-to-coal switching | ~USD 47–52/t |
| Bull case: LNG disruption persists 3+ months | USD 165–185/t | Sustained Hormuz closure; Qatar LNG offline | ~USD 55–63/t |
| Extended bull: Full LNG market dislocation | USD 180–240/t | Multi-quarter blockade; India/China spot demand surge | ~USD 60–80/t |
| Bear case: Ceasefire + Hormuz reopens Q2 2026 | USD 105–120/t | Diplomatic resolution; LNG restores; coal reverts | ~USD 37–43/t |
| Base case: Partial resolution; elevated LNG 6 months | USD 130–155/t | Intermittent disruption; sustained gas-to-coal switching | ~USD 44–53/t |
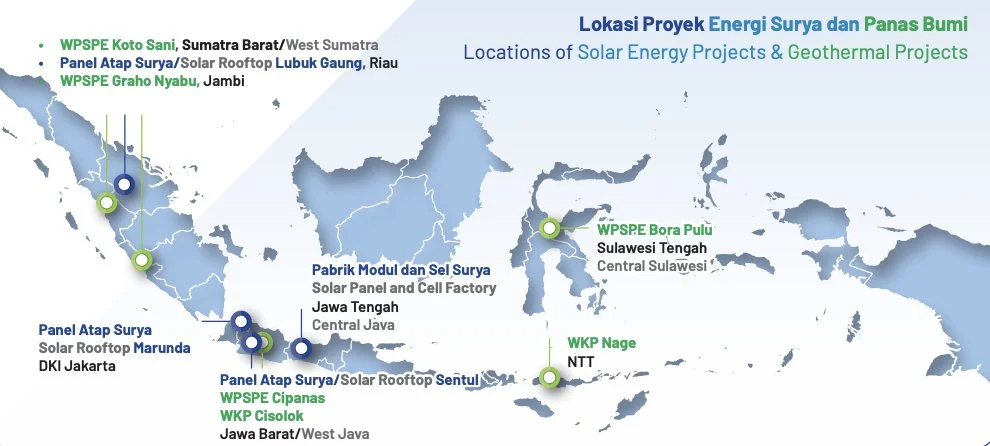
DSSA is developing geothermal power projects across three working areas, in a joint venture with PT FirstGen Geothermal Indonesia (EDC), Indonesia's dominant geothermal developer. The primary three WKPs are Cipanas and Cisolok-Cisukarame (both in West Java), and Nage (in East Nusa Tenggara/NTT). We also see a possibility of additional exploration-stage sites in Jambi, West Sumatra, and Central Sulawesi.
| WKP (Working Area) | Location | Planned Capacity | Status | COD Target |
|---|---|---|---|---|
| WPSPE Cipanas | West Java | ~50 MW (initial) | Exploration/Development | 2029F |
| WKP Cisolok-Cisukarame | West Java | ~50 MW (initial) | Exploration/Development | 2029F |
| WKP Nage | East Nusa Tenggara | ~40 MW (initial) | Exploration/Development | 2029F |
| Additional Sites (Jambi, W. Sumatra, C. Sulawesi) | Various | TBD | Early Exploration | Post-2030 |
| TOTAL PORTFOLIO | 150 MW (initial) → 480 MW (potential) | Multi-stage | 2029–2035+ |
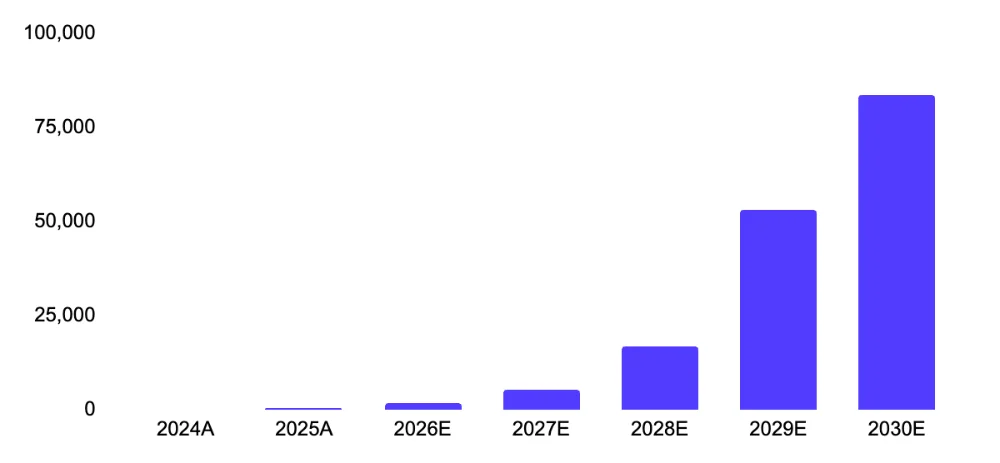
Geothermal's economic characteristics are uniquely suited to DSSA's risk profile and reporting convention. Unlike solar (25% capacity factor) or wind (30–40%), geothermal has a higher capacity factor, making revenue streams highly predictable. Three characteristics are directly value-accretive for DSSA: (1) PLN is mandated under Indonesia's national energy transition roadmap to increase renewable procurement, there is no merchant risk; PLN offtake is contractually enforced for DSSA's entire planned output; (2) geothermal projects finance at lower WACC (7–8%) vs. coal (9–10%) due to long-term contracted cash flows, improving project-level equity returns.
We value the geothermal portfolio at USD 2.6bn, using an EV/MW valuation benchmarked against listed Indonesian geothermal peers BREN (Barito Renewables), ARKO (PT Arkora Hydro) and PGEO (PT Pertamina Geothermal Energy) with EV/MW multiples of 5.4x.
In June 2025, DSSA's joint venture solar cell and module manufacturing plant in Kendal Industrial Park, Central Java, commenced operations, marking a historic milestone as Indonesia's first fully integrated solar cell and module production line. The facility is a three-way joint venture between DSSA, China's Trina Solar (one of the world's top five solar panel manufacturers), and PT PLN Indonesia Power Renewables.
The plant has an initial annual production capacity of 1-2 GW of solar cells and modules, with contractual expansion provisions to reach 2 GW annually, placing it among the larger solar manufacturing facilities in Southeast Asia. The facility produces both monocrystalline PERC and TOPCon cells, the current industry-leading efficiency technologies. By manufacturing domestically, the JV positions itself to benefit from Indonesia's local content requirements (TKDN) for solar power projects, which mandate increasing proportions of domestically produced components.
Complementing the manufacturing facility, DSSA operates Dian Solar, a solar PV engineering, procurement, and construction (EPC) division that installs customized rooftop and industrial PV systems for commercial and industrial clients. As of 2024, Dian Solar has a total delivery capacity of approximately 40 MWp, with ongoing projects for industrial clients across Java and Kalimantan. The Sinar Mas Group's own plantations, mills, and industrial facilities represent a substantial market for Dian Solar's solutions.
XLSmart, Indonesia's third-largest mobile operator with ~73mn subscribers post-merger. EXCL TP of IDR 3,600/sh (+52.5% upside from closing price 30 June 2026 - IDR 2,360), DSSA is implicitly worth ~USD 2.4bn.
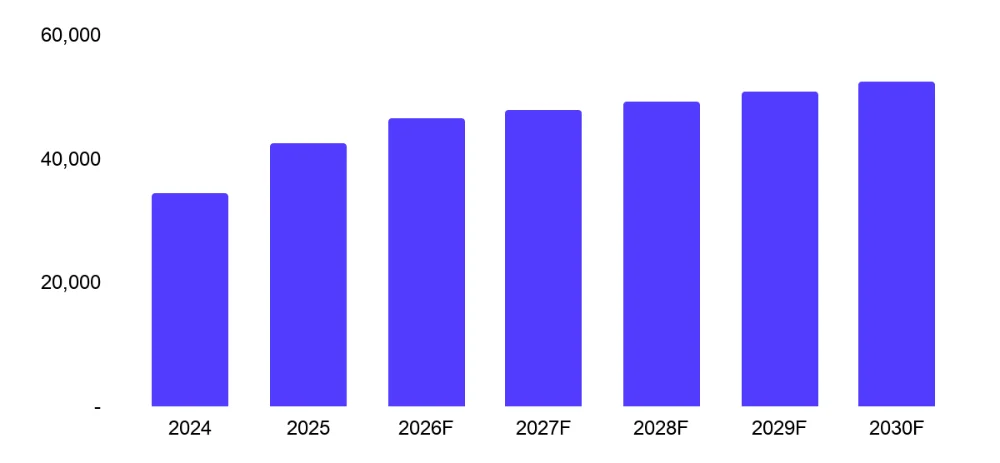
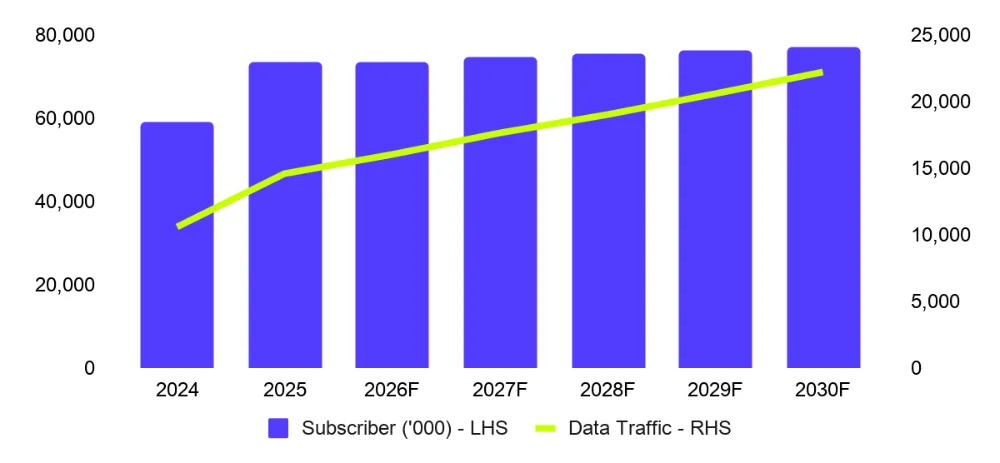
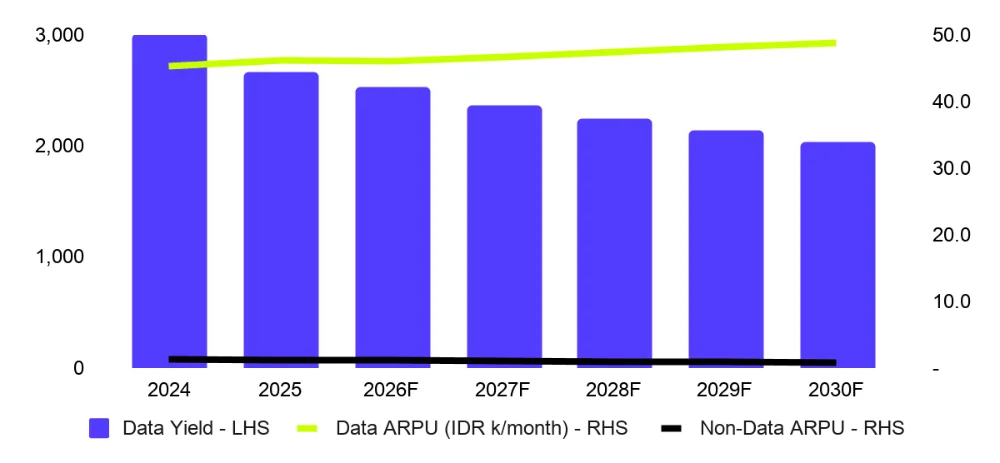
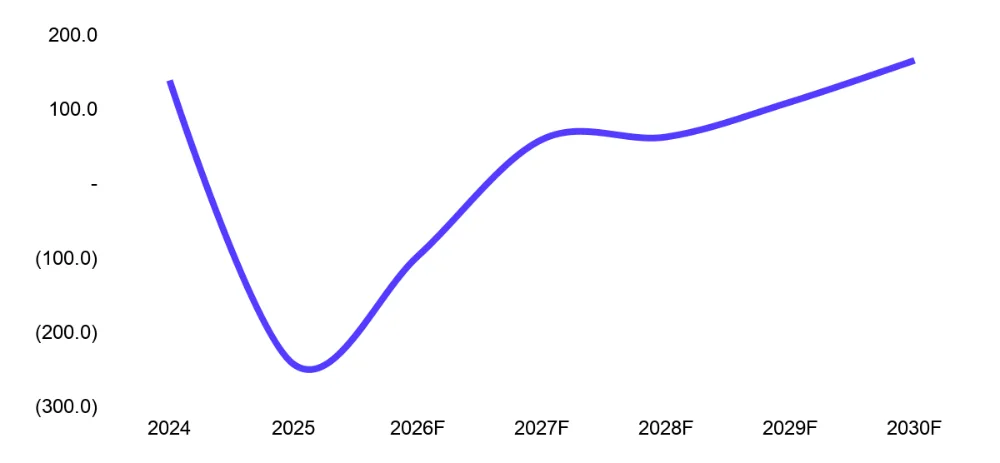
The merger creates Indonesia's third mobile operator of scale, a materially different competitive proposition than two subscale standalone players. XL established enterprise distribution and 4G/5G spectrum across 900/1800/2100/2300 MHz bands. Smartfren has its 2.3 GHz and 2.6 GHz holdings, well-suited to 5G NR in dense urban environments. Post-dedup, XLSmart serves ~73mn subscribers and uniquely operates Indonesia's only blanket 5G standalone network with 4x10MHz of dedicated 2300MHz spectrum delivering ultra-low latency and network slicing that no other Indo telco can match.
We forecast ~IDR 820bn of annual cash Opex synergy, realized through (i) consolidating ~10k overlapping tower sites and (ii) reduced customer acquisition cost as Smartfren subscribers migrate from brick-and-mortar distribution to EXCL's myXL digital app. Including capex synergies (shared RAN, consolidated tower contracts) and revenue synergies (B2B cross-sell into Sinarmas Group). EBITDA margin should expand from ~42% in FY25 toward ~51% by FY30F.
Tower dismantling has predictable economics: pre-merger XL and Smartfren operated independent networks with heavy overlap in Tier-1 and Tier-2 cities where both targeted the same dense urban catchments. Each tower carries fixed lease (~IDR 35–50mn/year to Mitratel/Protelindo), power, maintenance and backhaul costs that don't scale with utilization. Consolidating ~10k overlapping sites releases ~IDR 500–800bn/year of run-rate savings without service degradation, because the surviving footprint still covers the same area. Active equipment from decommissioned sites can also be redeployed to higher-traffic locations, reducing future capex.
CAC compression is a channel shift, not a coverage cut. Smartfren historically distributed through 100k+ physical kiosks paying ~IDR 30–50k commission per activation. EXCL has invested heavily in the myXL super-app which onboards subscribers via eKYC at near-zero variable cost. As the Smartfren base migrates to EXCL's digital stack, CAC drops by ~80–90% on the migrating cohort, while better targeting and self-service retention lifts customer lifetime value. Spectrum is complementary, not duplicative: XL contributed mid-low bands (900/1800/2100/2300 MHz) optimized for coverage; Smartfren added high-band 2.3/2.6 GHz suited for urban capacity.
XLSmart is not yet officially consolidated into DSSA — it currently sits as a Sinarmas Group-level telco asset (potential stake 35% ; JV with Axiata Group Berhad). Sinarmas Group has already run this exact playbook once, folding Moratelindo and MyRepublic into DSSA as MoraRepublic. We expect a repeat pattern with XLSmart — bringing mobile under the same roof as FTTH (MyRepublic + MORA), satellite (PSN), and data centers (SM+) — DSSA would complete a genuine four-layer converged architecture, the same structure that lets SoftBank, Deutsche Telekom, and Singtel trade at multiple-point EBITDA premiums to single-layer telcos. The synergy case, if consolidation follows, is concrete: (i) reduced churn via fixed-mobile bundles, (ii) shared network infrastructure — small cells on MyRepublic's fiber poles, eliminating duplicate civils and backhaul — and (iii) cross-selling DANA payments, Vidio content, and SM+ cloud into a 73mn+ mobile subscriber base, turning a distribution channel into recurring digital revenue. We treat this as probable optionality embedded in group strategy.
DSSA's fiber broadband business, operating under the MyRepublic brand, has emerged as one of the most compelling growth stories in Indonesian telecommunications. From a standing start, MyRepublic has built Indonesia's second-largest fiber-to-the-home (FTTH) network, trailing only Telkom's IndiHome, which has been operating for two decades.
| MyRepublic | FY2023 | FY2024 | FY2025 | 2026F Target |
|---|---|---|---|---|
| Home Passes (mn) | ~3.6 | 6.4 | 11 | 22 |
| Subscribers (mn) | ~0.5 | ~0.9 | 2.2 | 4.5 |
| Cities Covered | ~50 | 70+ | 80+ | 80+ |
| Municipalities (backbone) | ~110 | 144 | 160+ | 160+ |
The pace of MyRepublic's rollout is remarkable. The network backbone now connects 160+ municipalities across all major Indonesian islands, with a distribution architecture that enables rapid activation of new homes once backbone infrastructure is in place. The company is targeting 22 mn home passes and 4.5 mn total subscribers by 2026.
Average Revenue Per User (ARPU) for MyRepublic has been tracking in the IDR 200,000–300,000/month range, broadly in line with the Indonesian FBB market average. EBITDA margins in this segment face pressure from intensifying competition in Java. However, in ex-Java area markets which account for a majority of MyRepublic's home pass expansion remain significantly underpenetrated, providing a long runway for growth.
From a revenue architecture perspective, MyRepublic operates on a monthly recurring subscription model with relatively low churn (fiber infrastructure creates switching barriers). As the installed base scales, operating leverage improves materially: once backbone and street-level distribution costs are sunk, incremental subscriber additions require only CPE (customer premises equipment) installation costs.
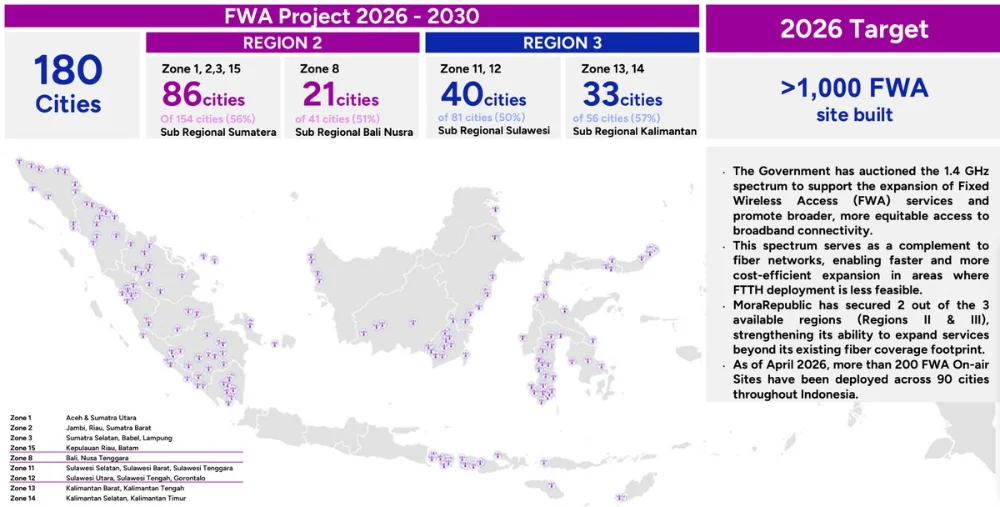
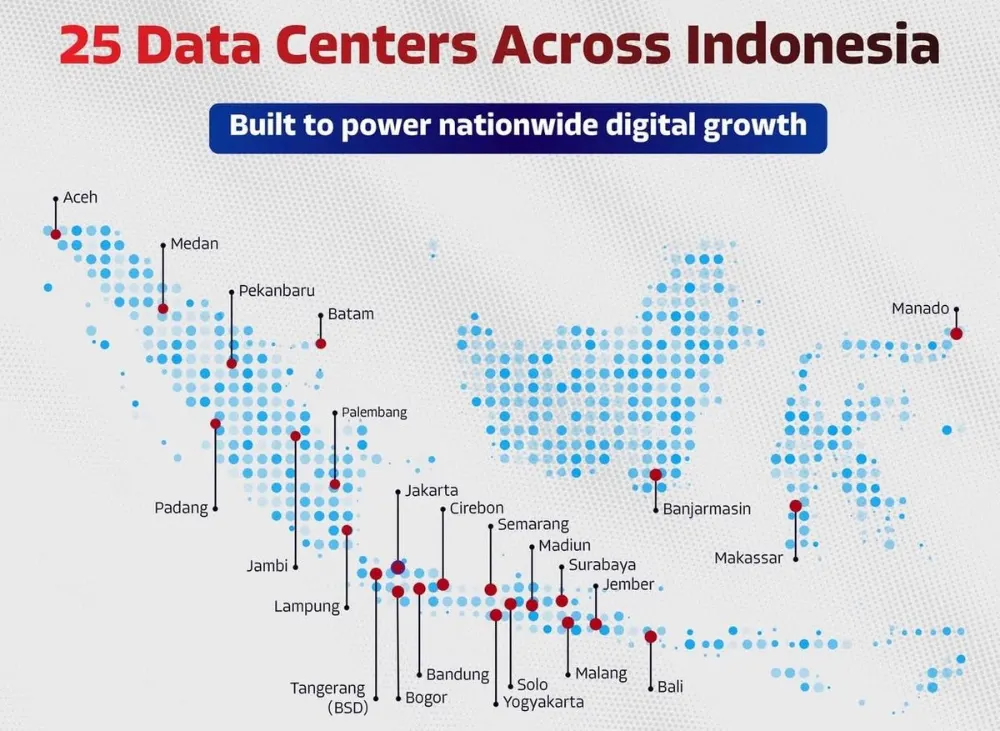
Through its SM+ subsidiary, DSSA operates one of Indonesia's most geographically distributed data center networks. The current portfolio comprises 25 edge data centers across 24 cities, with a combined IT load of approximately 24 MW (enterprise, wholly owned). The network spans Indonesia's major economic hubs, Jakarta, Surabaya, Bandung, Medan, Batam, Makassar as well as secondary cities including Solo, Jember, and Manado.
The edge data center strategy aligns well with the growing demand for low-latency content delivery and enterprise connectivity outside the Jakarta core. As Indonesia's digital economy expands into Tier-2 and Tier-3 cities, driven by e-commerce penetration, government digitalization initiatives, and growing SME IT adoption, proximity data center capacity becomes increasingly valuable.
The strategic crown jewel of SM+'s data center expansion is SMX01, Jakarta's first Tier IV AI-ready metro data center, being developed through a 50:50 joint venture with LG CNS (the IT services subsidiary of South Korea's LG Group). With an initial IT capacity of 18 MW at commercial operation date (expected 2H26) and can be upscaled to 60 MW, SMX01 is purpose-built to serve hyperscale cloud customers and AI-intensive enterprise workloads including large language model inference, GPU-accelerated computing clusters, and real-time data analytics.
Tier IV certification is the highest Uptime Institute standard, guaranteeing 99.9% uptime (less than 26.3 seconds of downtime per year), concurrent maintainability, and fault tolerance. This specification positions SMX01 to compete directly for global hyperscaler co-location contracts (AWS, Azure, Google Cloud) that require maximum reliability. The LG CNS partnership brings Korean engineering expertise and established relationships with international cloud providers into the fold.
We value SM+ using 18MW capacity at USD 180mn using a conservative cost basis of USD 10mn/MW (only calculate hyperscaler). The market-clearing rate for hyperscale Tier IV capacity in Southeast Asia ranges USD 15–25mn/MW for anchor-tenant pre-committed facilities. A single hyperscaler anchor tenant signing at SMX01 would re-rate the segment from USD 180mn toward USD 270–450mn of incremental SOTP value.
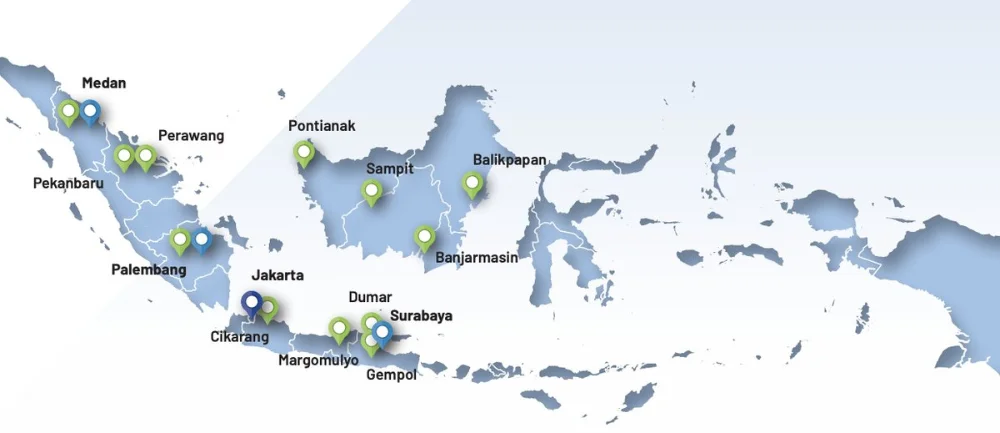
Through its subsidiary PT Rolimex Kimia Nusamas, DSSA operates a nationwide chemicals distribution business servicing Indonesia's agriculture and plantation sectors, 32% of total sales is affiliated with Sinarmas Group in FY25. Rolimex distributes fertilizers (CIRP, MOP, TSP), pesticides (Roll-up herbicide, Rolifos insecticide, Adjuvant), and specialty chemicals (PACL — Poly Aluminum Chloride for water treatment).
| Chemical Segment Metrics | FY2023 | FY2024 | FY 2025 | YoY Change |
|---|---|---|---|---|
| Total Chemical Revenue (USD mn) | ~208 | ~90 | 90.9 | +3.3% |
| Fertilizer Volume ('000 tonnes) | ~243 | ~126 | 127 | +14.0% |
| Pesticide Volume (mn kiloliters) | ~4.9 | ~5.6 | 7.3 | +30.2% |
| Estimated Market Position - Pesticides | Top 5 | Top 3 | Top 3 | |
| Share of Revenue from Affiliates | ~60% | ~54% | ~32% | External penetration growing |
The chemicals segment remains the smallest of DSSA's operating segments and is unlikely to be a primary value driver in the investment thesis. However, it serves an important strategic role: maintaining Sinar Mas Group's supply chain for agricultural inputs, providing DSSA with market intelligence on Southeast Asian agricultural commodity cycles, and contributing to the Group's procurement advantage. Structurally, the more interesting development is the deliberate reduction in affiliate revenue dependency from ~60% in FY23 to ~32% in FY25 as Rolimex expands into external markets across Java, Sumatra, and Kalimantan, with nascent export activity beginning to contribute. If this trajectory holds, the segment's earnings quality improves even without meaningful revenue growth.
This report has been prepared by PT Pluang Maju Sekuritas on behalf of itself and its affiliated companies and is provided for information purposes only. Under no circumstances is it to be used or considered as an offer to sell, or a solicitation of any offer to buy. This report has been produced independently and the forecasts, opinions and expectations contained herein are entirely those of PT Pluang Maju Sekuritas. While all reasonable care has been taken to ensure that information contained herein is not untrue or misleading at the time of publication, PT Pluang Maju Sekuritas makes no representation as to its accuracy or completeness and it should not be relied upon as such. This report is provided solely for the information of clients of PT Pluang Maju Sekuritas who are expected to make their own investment decisions without reliance on this report. Neither PT Pluang Maju Sekuritas nor any officer or employee of PT Pluang Maju Sekuritas accept any liability whatsoever for any direct or consequential loss arising from any use of this report or its contents. PT Pluang Maju Sekuritas and/or persons connected with it may have acted upon or used the information herein contained, or the research or analysis on which it is based, before publication. PT Pluang Maju Sekuritas may in future participate in an offering of the company's equity securities. This report is not intended for media publication. The media is not allowed to quote this report in any article whether in full or in parts without permission from PT Pluang Maju Sekuritas. For further information, the media can contact the head of research of PT Pluang Maju Sekuritas. This report was prepared, approved, published and distributed by PT Pluang Maju Sekuritas located outside of the United States (a "non-US Group Company"). Neither the report nor any analyst who prepared or approved the report is subject to U.S. legal requirements or the Financial Industry Regulatory Authority, Inc. ("FINRA") or other regulatory requirements pertaining to research reports or research analysts. No non-US Group Company is registered as a broker-dealer under the Exchange Act or is a member of the Financial Industry Regulatory Authority, Inc. or any other U.S. self-regulatory organization.
This report is prepared and issued by PT Pluang Maju Sekuritas ("PMS"), a securities company licensed and supervised by the Otoritas Jasa Keuangan ("OJK"). The report is distributed to users of the Pluang application ("Pluang App") pursuant to an arrangement under which PT Sarana Santosa Sejati ("SSS") acts as Mitra Pemasaran Perantara Pedagang Efek ("MP3E") of PMS, and PT Bumi Santosa Cemerlang ("BSC"), the operator of the Pluang App, serves as the delivery channel. PMS, SSS and BSC are members of the Pluang group. SSS and BSC do not act as advisor and do not provide any investment recommendation; their role is limited to marketing and delivery of this report.
The forecasts, opinions and expectations contained herein are those of PMS's research analyst(s) as at the date of publication and are subject to change without notice. While reasonable care has been taken to ensure the information is not untrue or misleading at the time of publication, neither PMS, SSS, BSC, nor any of their respective directors, officers, employees or affiliates makes any representation or warranty, express or implied, as to the accuracy, completeness or reliability of the information, and none of them accepts any liability for any direct, indirect or consequential loss arising from any use of, or reliance on, this report or its contents, to the maximum extent permitted by applicable law.
Investment Risks. Investing in securities involves risk, including possible loss of principal. Past performance is not a reliable indicator of future results. Prices, values and income from investments may fall as well as rise, and investors may not get back the amount originally invested.
Complaints and Dispute Resolution. Complaints in respect of this report or services provided by PMS may be submitted to PMS at info@pluangmajusekuritas.com. Complaints in respect of the Pluang App or distribution may be submitted to BSC via the official complaint channel. Unresolved disputes may be escalated to the OJK Consumer Service (Kontak OJK 157, konsumen@ojk.go.id) and, where applicable, to the Lembaga Alternatif Penyelesaian Sengketa Sektor Jasa Keuangan.
Distribution Restrictions. This report is intended for distribution in the Republic of Indonesia to users of the Pluang App. It is not intended for distribution to, or use by, any person in any jurisdiction where such distribution or use would be contrary to law. This report is not intended for media publication; media outlets may not quote this report in whole or in part without prior written permission from the Head of Research of PMS.
Analysts Certification: Each contributor to this report hereby certifies that all the views expressed accurately reflect his or her views about the companies, securities and all pertinent variables. It is also certified that the views and recommendations contained in this report are not and will not be influenced by any part or all of his or her compensation.


